2020 Presidential Election Analysis
Eric White
Post-election Reflection
November 23rd, 2020
Key takeaways
- My model correctly predicted 48 of the 50 states and missed 1 Congressional district as well
- In terms of margin of victory, my model struggled the most with non-competitive states, and although that is preferable to struggling with swing states, it is still certainly something I would like to address in order to improve the model.
- Like most statistical models for this election, my model tended to underestimate Trump’s support; in the future, I might look to include a regression involving geographic variables to try to better understand and account for the growing urban-rural divide in this country.
Model recap
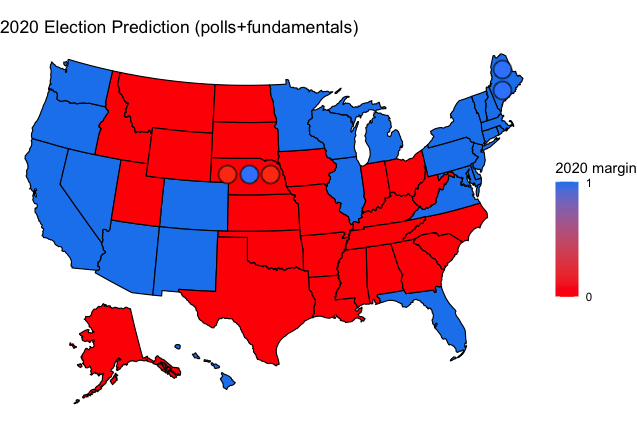
My model was a weighted ensemble of polls and fundamental data about each state. The fundamentals part of the model considered the percentage of the state population that is white, black, and over age 65, as well as the unemployment average for that state for 2020. The polls aspect of my model, which was weighted overwhlemingly more than the fundamentals, weighed the sample size, recency, and quality of the polls to create an average of polling in each state. When polling data was not available, 2016 election performance was used as a proxy, as this tends to be an effective way to predict the result, particularly in safe states that are not likely to see a massive partisan swing. Above is my map predicting which candidate would win each state. My predictions for the two-party popular vote share in each state are given below, with italicized states being ones that I expected to be within 10 points and bold states being ones that I got wrong in my prediction.
| State | Biden | Trump | Margin |
|---|---|---|---|
| Alabama | 38.59333 | 61.40667 | -22.8133335 |
| Alaska | 44.9704 | 55.0296 | -10.0592015 |
| Arizona | 52.29683 | 47.70317 | 4.5936599 |
| Arkansas | 32.60462 | 67.39538 | -34.7907626 |
| California | 60.00608 | 39.99392 | 20.012162 |
| Colorado | 66.29099 | 33.70901 | 32.581973 |
| Connecticut | 65.9992 | 34.0008 | 31.9984097 |
| Delaware | 54.77868 | 45.22132 | 9.5573532 |
| Florida | 52.33308 | 47.66692 | 4.6661634 |
| Georgia | 49.57594 | 50.42406 | -0.8481217 |
| Hawaii | 69.45923 | 30.54077 | 38.9184529 |
| Idaho | 27.23193 | 72.76807 | -45.5361431 |
| Illinois | 52.78234 | 47.21766 | 5.5646771 |
| Indiana | 46.2933 | 53.7067 | -7.4134013 |
| Iowa | 47.7414 | 52.2586 | -4.5171941 |
| Kansas | 47.17733 | 52.82267 | -5.6453317 |
| Kentucky | 38.38104 | 61.61896 | -23.2379185 |
| Louisiana | 37.9485 | 62.0515 | -24.1029913 |
| Maine | 58.13816 | 41.86184 | 16.2763246 |
| Maine CD-1 | 59.61712 | 40.38288 | 19.23424 |
| Maine CD-2 | 51.58011 | 48.41989 | 3.160226 |
| Maryland | 63.26843 | 36.73157 | 26.5368671 |
| Massachusetts | 68.41095 | 31.58905 | 36.8219098 |
| Michigan | 53.829 | 46.171 | 7.6580061 |
| Minnesota | 50.15969 | 49.84031 | 0.3193855 |
| Mississippi | 41.55102 | 58.44898 | -16.8979535 |
| Missouri | 45.40799 | 54.59201 | -9.1840274 |
| Montana | 37.72969 | 62.27031 | -24.5406214 |
| Nebraska | 39.72492 | 60.27508 | -20.550163 |
| Nebraska CD-2 | 53.03052 | 46.96948 | 6.061034 |
| Nevada | 51.65607 | 48.34393 | 3.3121466 |
| New Hampshire | 63.00037 | 36.99963 | 26.0007314 |
| New Jersey | 60.29657 | 39.70343 | 20.5931497 |
| New Mexico | 55.54129 | 44.45871 | 11.0825785 |
| New York | 64.20354 | 35.79646 | 28.4070745 |
| North Carolina | 48.94769 | 51.05231 | -2.1046133 |
| North Dakota | 39.61115 | 60.38885 | -20.7776914 |
| Ohio | 48.0239 | 51.9761 | -3.9522071 |
| Oklahoma | 40.54972 | 59.45028 | -18.9005671 |
| Oregon | 55.91936 | 44.08064 | 11.838716 |
| Pennsylvania | 52.75727 | 47.24273 | 5.5145449 |
| Rhode Island | 58.85695 | 41.14305 | 17.7139041 |
| South Carolina | 46.03663 | 53.96337 | -7.9267354 |
| South Dakota | 41.65608 | 58.34392 | -16.6878349 |
| Tennessee | 37.11921 | 62.88079 | -25.7615867 |
| Texas | 47.97994 | 52.02006 | -4.0401226 |
| Utah | 35.36543 | 64.63457 | -29.2691433 |
| Vermont | 68.64464 | 31.35536 | 37.2892791 |
| Virginia | 55.26281 | 44.73719 | 10.525627 |
| Washington | 60.19279 | 39.80721 | 20.3855821 |
| West Virginia | 38.99759 | 61.00241 | -22.0048129 |
| Wisconsin | 52.3016 | 47.6984 | 4.6032081 |
| Wyoming | 20.71385 | 79.28615 | -58.572306 |
Ultimately, I predicted Biden would win with a 320-218 Electoral College margin, off by 14 delegates from the actual amount of 306-218. The two states that I predicted incorrectly were Florida, which I erroneously had going for Biden, and Georgia, which I predicted would go to Trump. Additionally, I predicted Maine’s 2nd Congressional District incorrectly, as this was the district where Trump most massively overperformed the polling and did so by an amount that was very difficult to account for in a model.
Accuracy of my model
My model tended to overpredict support for Trump, but nevertheless, I was satisfied with the result of the model, as I ended up with a root mean square error of 4.213276 for my statewide predictions. This is relatively low and although I wish that I had performed better in certain states, the ultimate result of the model was largely accurate. One reason as to why I could have systemically underrepresented Trump’s support in my predictions is that I did not account for geography, and there is a very large and increasingly growing partisan divide among urban and rural voters, as David Hopkins argues in his book Red Fighting Blue. Instead of racial demographic factors, it may have been more worthwhile to include urban, suburban, and rural demographic breakdown factors into my model, as it is possible that this would have been more predictive. Racial demographic factors would have also been, to some extent, baked into a demographic analysis because there is a racial component to the urban-rural divide. Including these values could have helped to make the fundamentals aspect of my ensemble more relevant, as I felt that the information conveyed in that part of the model may have been extraneous.
Another trend, at least from looking at a map of my errors, is that there seems to be a clear geographic trend to these errors. In particular, I tended to favor western states in Trump’s direction and northeast states in Biden’s direction to an unnecessary degree in my model. This could be a result of the polls being incorrect or just a function of incomplete data, but I would also imagine that some of it has to do with the demographic variables that I included in my model. It is possible that these states in the northwest tend to be whiter and that my model underestimated Biden’s support from Black voters. To contrast with the Northeast, the demographics aspect of my model may have favored Democrats in these areas. It is hard to explain, at least based on that rationalization, why California favored Trump more than it should have in my model and why West Virginia favored Biden more than it should have in my model, but it is possible that these states, which both have higher than average unemployment, could be drawn to one extreme or the other. Additionally, these are highly partisan states, so in addition to there not being sufficient polling in these areas, it is also possible that the modeling process that allowed me to obtain generally accurate results in close states is not as applicable to safe states because of the partisan dynamics. For example, in California this year, Biden won a greater percentage of the vote than Clinton in 2016, yet won by a smaller margin than she did, in large part due to third party voters. The broader conclusion to be drawn from that phenomenon and the deficiencies that the model had in closer states is that there is more room for error in these partisan states, so a shift of a few points in one direction or the other might look meaningful when examining a graph like the one below, but in the grand scheme of things, when analyzing the election, these deviations are largely irrelevant.
Ultimately, of all of the possible explanations I provided, I think the last one makes the most sense. Stronghold states like California, Illinois, Idaho, West Virginia, and Wyoming were the states with the greatest errors in their prediction, which gives credence to the idea that the model struggles with highly partisan states. The trend of large errors in safe states is a much stronger trend than the geographical trend mentioned above, though that is certainly relevant as well.
Below are two graphs, the first of which shows all states and how far off my predictions were. The second graph isolates only the states that I predicted to be within 10 points with my model.

Close states only

Testing that hypothesis
Looking first at the hypothesis that I should have included geographic variables, it would make sense to build a similar model, but instead of including a regression based on whether voters were white, black, or senior citizens, I would run a regression using urban, rural, and suburban (or I could just include the senior citizen variable in place of the suburban variable, as presumably the urban, rural, and suburban variables would not be linearly independent). I would then bring that regression into my weighted ensemble and test to see if the results were superior in this iteration of the model, not only for 2020, but also for 2016, as I retroactively predicted the 2016 election in order to see if my model was rational. If the RMSE was lower or I was able to improve the results of my model, then I might be able to conclude that this was a superior approach, or at the very least, this modeling choice would have some merits moving forward.
I would assume that the geographic and hyperpartisan-state hypotheses would be able to be tested in a similar way. Specifically, I could attempt to use my model on previous years to see if the same phenomena are seen. If it is the case that the same states tend to be pulled in one direction or the other, then there might be evidence that the model has a certain geographic bias. Looking specifically at the partisan states, I could also potentiall artificially increase the polling margin for a randomly chosen swing state to see if the prediction would remain as far off in order to see if the model truly was less effective for partisan states. In this sense, I would be keeping the demographic variables constant but changing the polling and if the discrepancy was still meaningful, I might look to change certain variables in my regression or incorporate historical data for non-swing states in order to improve the predictions in these states.
Improving the model for the future
One item I wish that I had addressed in my original model was representing turnout. I had made attempts at modeling turnout in past blog posts and although I was able to predict the probability that an individual vote would go to a given candidate based on turnout, these models felt relatively arbitrarily decided and I did not feel confident in adding them to my model. Also, an assumption that I operated under was that in general, high turnout would mean better Democratic performance. This was not explicitly stated in the modeling for turnout that I had done, but the historical data pointed in that direction and there is research that indicates the same phenomenon. This was not necessarily the case this year, and although increased turnout seemed to lead to better performance for Biden, particularly in Georgia, Michigan, and Wisconsin, it would be hard to generalize this to the entire population as a whole, which is what I assumed a model for turnout would do. I am unsure how I would be able to properly model turnout, particularly in a year such as this, where one could make the argument that COVID-19 would decrease turnout, but increased vote-by-mail would increase turnout. Not only would I struggle to be able to retroactively determine how to accurately model turnout (something that also contributed to polls being off this year), I would be unsure as to how to apply that methodology to future elections that would not be impacted by COVID and may not have the same portion of the electorate voting by mail.
Additionally, I wanted to consider a way to model the relationship between states in order to create a more robust model. For example, if I know that Michigan will go to Biden, then it is reasonable to assume that Wisconsin will also go to Biden, as these states tend to have similar voting patterns. If I were to do this, I would probably consider which states voted together most often in presidential elections as well as geography and the partisan makeup of their legislatures, which may give me a clue as to how similar certain states are to each other in terms of partisanship. This could help my model become more effective at predicting certain outcomes, and the best and worst cases scenarios that I predicted might make more sense for each candidate; that being said, there could be drawbacks to this approach, as states are not monolithic and may have different underlyng trends; one might assume that Georgia and Florida would vote similarly based on these criteria outlined above, but they did not vote together in this election and I did not predict them to vote in the same way in my model either (though my model was incorrect about both states).
Conclusion
In the end, although I am happy that my model predicted the correct winner and many of the states, there are still a number of areas of improvement. I think it is certainly possible that my model depends too much on polls and it could be susceptible to error in that regard. I did not appropriately account for the urban-rural divide and generally struggled to predict Trump’s support across the board, as he tended to overperform my model, with the exception being some western states. My model had a root mean square error of 4.213276, and althoug this is reasonably accurate, it is still important considering one can produce an exceptionally accurate result in RMSE terms just by looking at the 2016 results while generating no other statistical inference.