2020 Presidential Election Analysis
Eric White
Blog Post 6 - Demographics & Turnout
October 19th, 2020
In this week’s blog, I wanted to explore how demographics can influence the presidential race, specifically looking at race as a naive predictor for voting patterns. Generally, non-white voters lean Democratic, particularly African-American voters, who voted for Clinton at about a 90% rate in 2016. I looked at Pennsylvania in particular because it is an important swing state in the 2020 presidential election and because it is one of the six states won by Obama in 2012 and Trump in 2016. On top of that, unlike some of those other states, it is more racially diverse, with a substantial black population in the urban areas of Philadelphia and Pittsburgh. I also looked at turnout to see what this would do to my modeling results. It is hard to know exactly how successful I was in determining the effects because the model relies on historical data and I only examined swing states, some of which were not swing states in the past, but the exercise is worthwhile anyway.
Key takeaways
- We can use demographic data to model the result of the election and make relatively accurate predictions in doing so.
- At least for Pennsylvania, the demographic prediction tends to favor Republicans, presumably because it gives more weight to rural areas relative to urban areas.
- Turnout is a helpful metric to understanding the results of the election more broadly and can be a useful modeling tool; this model that includes a turnout component sees Biden winning a number of the key swing states.
Pennsylvania Demographic prediction
Using 2010 census data, I examined the demographics of the state of Pennsylvania on a county-by-county level in order to see how predictive it was in understanding the results of the 2016 election. I used the percentage of the population that was white, black, Asian, and Hispanic to as explanatory variables for the 2016 result. The relationship was actually fairly compelling for the 2016 election, with 82.6% of the variance of the election data being explained by the independent variables.
| Estimate | SE | |
|---|---|---|
| (Intercept) | -6.26 | 4.619 |
| black | 7.330 | 4.869 |
| white | 6.129 | 4.643 |
| hispanic | 4.659 | 2.520 |
| asian | 17.767 | 4.698 |
| R2 | 0.826 |
An interesting result was that, all else equal, the Democratic candidate actually performed better with a higher percentage of white voters, which is interesting but may not necessarily be reflective of the actual relationship between these two variables, particularly because when a regression was run using only white population percentage as the only independent variable, the relationship was actually negative, which makes more sense.
There are some limits to this model, specifically that there is no available and reliable countywide demographic data other than the census, which was last conducted in 2016. That means that, were I to use the results of the 2016 (or the 2012) model to predict the results, the prediction would simply be the exact same as the prediction used to test how accurate the 2016 model is, as there is no updated data for this year’s demographics. This model, for both 2012 and 2016, was fairly accurate in 2016, predicting an Obama win in 2012 by around 2 percentage points in terms of two party popular vote share (compared to a 5.5 percentage point share in reality) and a Trump win by around 5.5 percentage points (compared to a .75 percentage point share in reality). From this, it seems like the model overestimates Republicans and underestimates Democrats. However, looking at the residual map below, it appears like the opposite, with a number of counties actually underrepresenting Republicans. This is probably because the GOP tends to perform better in rural areas, which many of these counties could very well be, and the regression causes the Republican candidate to perform much better than reality in Philadelphia, for example, which greatly inflates the vote totals for the state as a whole in favor of Republicans.

Above is the actual result from the 2016 election in Pennsylvania by county

Above is the predicted result from the 2016 election in Pennsylvania by county using demographic data

Above is the error of predicted result from the 2016 election in Pennsylvania by county using demographic data, where blue means the model disproportionately favors Democrats and red means the model disproportionately favors Republicans,
Turnout and updated model for swing states
Using historical data from past presidential elections, I simulated turnout and results for the Democratic candidate in 10 swing states for the 2020 election, namely Wisconsin, Michigan, Pennsylvania, Arizona, Florida, Ohio, Texas, Iowa, North Carolina, & Georgia. Then using polling data from recent polls, I predicted the probability that a representative voter from each of these swing states would vote Democratic using a probabilistic model.
Because I used historical data going back to 1980, the results may not be entirely accurate for this election, particularly because states like Arizona and Texas have not been swing states until recently. Turnout tended to favor Democrats in general, but there are exceptions, particularly in the historically red states that I counted as swing states for this exercise. The ultimate result of the model is below:
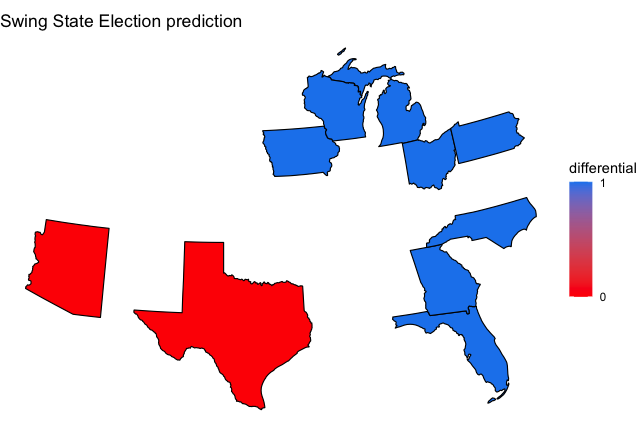
If this result occurs and the other states that are less likely to be swing states remain as they are expected, this would lead to Biden winning with of upwards of 360 electoral college delegates, with the exact amount depending on the results of the congressional districts of Maine and Nebraska, which are also swing districts but were not modeled. This result is around the median of FiveThirtyEight’s simulations, but it is difficult to believe that the election will play out precisely this way because of the correlation betweeen different states; for example, it seems unlikely that Biden will win Georgia (where he is not clearly favored), but lose another former Republican stronghold in Arizona that seems more likely to go to him.