2020 Presidential Election Analysis
Eric White
Blog Post 5 - Air War & Probabilistic Models
October 12th, 2020
In this week’s blog, I wanted to explore the effects of advertising data on the presidential race. I looked at both parties and how advertising dollars spent impacted their performance in the race over time from 2000 to 2012, then I tried to draw conclusions on what might happen in the 2020 race from this data. Additionally, I wanted to explore probabilistic models to see if I could draw any different conclusions on the race by taking a different modeling approach
Key takeaways
- There appears to be a more noticeable positive trend in terms the relationship between advertising dollars spent and vote share for Democrats than Republicans.
- This model predicts a 322-216 Biden victory in the electoral college, but there were some issues in terms of category errors from using a simple linear model.
- A probabilistic model in various swing states was helpful in determining a possible range of outcomes for the margin of victory in the election.
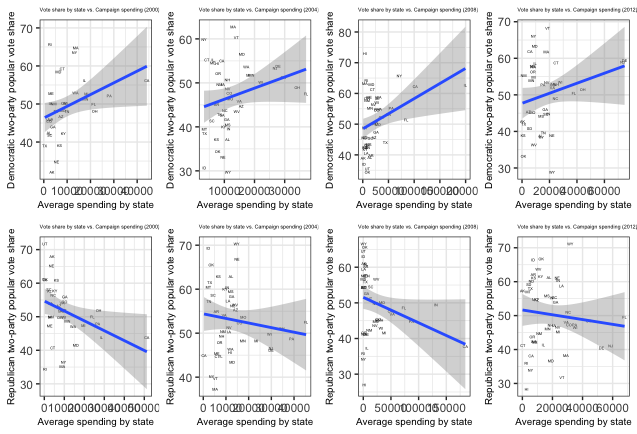
Advertising dollars and vote share relationship, 2000-2012
An interesting phenomenon was that Democrats tended to win a greater percentage of the vote in states where they spent more money, while Republicans saw a decrease in vote share on average when spending more money. This is probably not the right conclusion to draw from this model. Republicans do not do well electorally in states with bigger media markets like New York and California, but they nevertheless end up spending more in these places regardless, which contributes to the trend. There was also a good deal of variance in terms of how close these two variables were related, making me think that there are other factors at play, or that advertising money is probably not the best metric for measuring electoral success when examining it by itself. Another important point is that the spending values are all on the same scale, that being total dollars spent, but this biases the value in favor of bigger states. Yes it is true that it costs more money to buy an ad in a swing state like Ohio as compared to neighboring West Virginia, but the bigger driver for increased costs in certain states across the board is likely that some states just have more expensive media markets.
Advertising spending in 2020
As stated above, the model is not entirely useful because it can lead to category errors where one candidate ends up with greater than 100% or less than 0% of the vote. Nevertheless, this is an important result to explore, particularly for swing states, which overwhelmingly go to Biden in this model. It is possible that the analysis was flawed from the start, as in order to get the right data, I had to assume that each ad cost the same amount of money in order to get the total ad spending for each candidate, which may not have been an appropriate assumption. I also assumed that the states for which there was no data, Kansas, Delaware, New Jersey, Rhode Island, and Washington D.C., would go to the candidate that is overwhelmingly favored in each of the states, which is a fair assumption.
The bigger issue is that many states that are highly unlikely to change parties are expected to with this mode, such as Alabama & Indiana going to Biden and Massachusetts and Washington going to Trump, which seem unlikely. In the end, I probably could have set up the model different to achieve a different result, but it is hard to believe that ad spending is all that valuable of an indicator when used by itself.

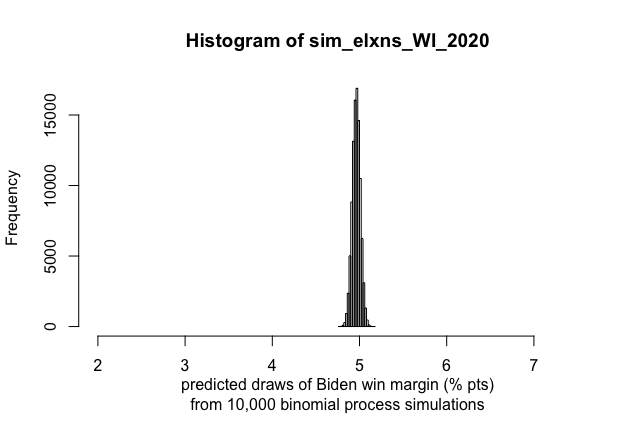
Probabilistic model
Using a probabilistic model, I drew from 10,000 samples of potential polling results for both Biden and Trump in the crucial swing states of Michigan and Wisconsin. Both models see Biden winning with a comfortable margin, with his margin of victory hovering around 5% in Wisconsin and 6% in Michigan. This process could be flawed because the variance of the distribution is very small, but even as a point estimate, there is some value in this exercise.