2020 Presidential Election Analysis
Eric White
Blog Post 4 - Incumbency
October 5th, 2020
In this week’s blog, I wanted to explore how incumbents fair in their bid for re-election and hopefully use that intuition to improve my model for the future. One of the most renowned models that focuses on fundamentals is the The time-for-change model developed by Alan Abramowitz to predict the two-party national popular vote share using 2nd quarter GDP growth in the election year, the incumbent candidate’s June approval rating in the election year, and whether or not they are an incumbent in order to predict the popular vote total. It notoriously was one of the few models that predicted that Trump would defeat Clinton in the popular vote in 2016 (which ultimately did not happen, but the intuition was valuable nonetheless). Given how unique this election is, I am skeptical of how the time-for-change model will predict this election, but considering how stable this model tends to be, it is still worth exploring. I additionally wanted to look into how spending directed to certain states might impact the race. Specifically, I looked at swing states to see if there was any predictive power in seeing how a change in funding from the year before an election year to the year of an election might be correlated to election results. As an extension, I used COVID-19 spending data to see if there was any way to determine if the awards of COVID funds to certain states had any impact on the election. Finally, I updated my election model based on the polling data that was available to us last week. Not only did I use this to help in my examinination of the impacts of COVID-19 on the results, but I also wanted to get more practice with working on my model.
Key takeaways
- The time-for-change model is not particularly valuable for this election, largely because of the incredible outliers in terms of both GDP growth and presidential approval rating.
- There does not appear to be any meaningful impact of spending on the results of elections in swing states, at least based on my analysis. There are certainly other variables at play that could change this relationship.
- There is only a relatively weak positive impact of COVID relief spending on voting share, but this result is subject to many biases and may not be particularly informative.
- I predict Biden to win the electoral college in a 351 to 187 margin, but this result is based on relatively old polling data and is subject to the assumptions I made in weighing the polls.
Is Time-for-change valuable in this election?
On the whole, incumbents tend to do fairly well in elections. There are a number of explanations for this, such as risk aversion on the part of the voters, the governing experience of the incumbent, or the fact that they have already been able to win, which might signal that they are more capable of being the president. Only 3 times in the postwar period has an incumbent president lost their re-election bid, and it is reasonable to state that there were relatively unique circumstances surrounding the 1976, 1980, and 1992 elections. Specifically, Ford was inextricably linked to the corruption of the Nixon administration thanks to his decision to pardon his predecessor. Carter suffered from high levels of inflation during his presidency which is generally not easy to control. Bush had to contend not only with Clinton but also a successful 3rd party candidate in Ross Perot. This year is a particularly unique set of circumstances, as not only is their a public health crisis, but there is also a related economic crisis that certainly weighs on the lives of voters. Anecdotally, it seems, we should expect Trump to lose re-election, and the time-for-change model seems to take into account some of the factors, in some manner, that could cause Trump to lose. His approval rating could fall due to coronavirus. The GDP could fall thanks to the economic crisis. That being said, however, I do not think that time-for-change model is useful because of how anomalous these events are. The model predicts Trump to, more likely than not, win less than 40% of the vote, which seems unlikely. This is in part because of the massive Q2 decrease in GDP, and although the economy is not in good shape, that is such an outlier value that it will produce distorted results. When The Economist creates their model which uses fundamentals, they actually bound the GDP numbers at a level much less severe than reality indicates, and I trust their intuition that an outlier of that magnitude is not useful for prediction. Similarly, Trump has a low net approval rating and although it is not an outlier like George W. Bush’s was when he left office, it is still relatively close to the extreme end of the spectrum.

Impacts of state spending on electoral outcomes
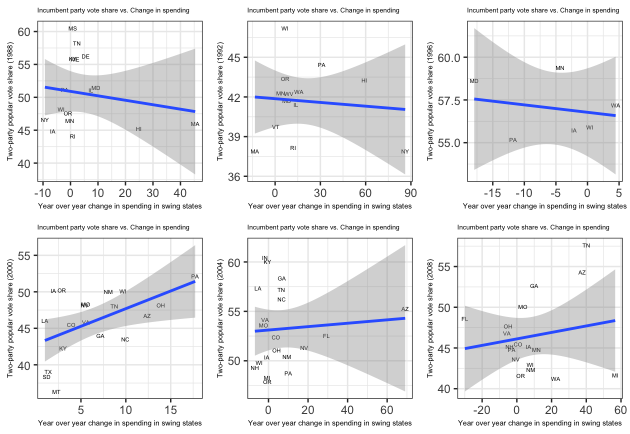
It might make sense for federal spending to have an impact on the election, as the president has the opportunity to play “pork-barrel politics” and spend more money in swing states, as we see to some extent from Kriner & Reeves’ findings. I examined swing states from 1988 to 2008 to see if increases from one year to the next in spending corresponded to a larger vote share in that state, and the results were largely inconclusive. I chose to look at the change from one year to the next because I expected there to be some degree of consistency from year to year in terms of spending, but over the long term, spending would increase across all states, making it hard to find an apples to apples comparison across time. The only year in which I found an interesting result was the 2008 election, where McCain tended to do better in the states where Bush spent more money. It is hard to see if there is any sort of meaningful relationship in this instance as Bush did not have a massive incentive to see McCain get elected in the same way that he would have if it were 2004 and he were running for re-election. It probably would have made more sense to explore per capita spending and look at the changes as a percentage of the previous year’s total, but unfortunately I did not look into this, as it is very possible that there would have been a different and more decisive correlation.
Impacts of COVID on the state of the race
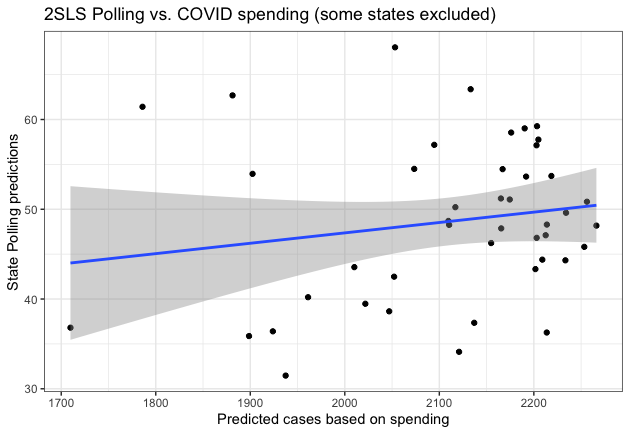
There were a number of directions I could have gone in to examine the effects of COVID spending on the election. One might naïvely think that there would be more spending on a per-capita basis for swing states in order to help the president’s re-election chances, but there did not appear to be any effect like this. In fact, Florida, Minnesota, Nevada, Ohio, Texas, and Wisconsin all received less spending than the regression predicted, and all of those states look to be competitive in November. If I wanted to examine how coronovirus impacted the results of the election and I specifically wanted to factor in COVID-related spending, then it made sense to bring in COVID cases as another variable. It is reasonable to assume that states that have been hardest hit might be hard states for President Trump to win as he is still performing relatively poorly in terms of his COVID response. I also figured that it might make sense that there would be a relationship between cases per capita and COVID award money per capita. An assumption I made was that the only way in which these awards would impact the state of the race in a state is through their effect on the number of COVID cases.
Therefore, I used COVID relief fund spending as an instrumental variable and ran a two-stage least-squares regression. Based on the assumptions above, COVID relief satisfies the conditions for an instrumental variable, specifically that it is correlated with the independent variable (COVID cases) and is only correlated with the dependent variable (election performance as estimated by polling results) through its effect on the dependent variable. In two-stage least squares, I first use COVID relief funds to predict the COVID cases (this relationship was not as strong as I had expected) by running a regression, then I used those predicted COVID cases from the spending data to determine what the impact would be on the polls. There were a few issues that resulted that probably limit how impactuful the result that I found was. For one, there were a lot of predictions stacked on top of each other that add bias. The polls are used to predict the election result and not only could the polls be wrong, but I also could have weighted them incorrectly and skewed the result. Next, by running two regressions, the error from the first regression is baked into the second regression, leading to even more bias, which is particularly bad considering how little of the variance of COVID cases was explained by the COVID funds in that state. Finally, there were some pieces of data that had to be excluded. Alaska was an outlier in terms of the funds they received relative to how many cases they had, so they were removed to see if the relationship changed. Additionally, polling data was not available for Illinois, Nebraska, Rhode Island, South Dakota, & Wyoming, which makes the results harder to generalize to the real world.

An update to my model (w/ state-wide predictions)
Finally, I wanted to use this week to attempt to weigh the polling averages in order to construct my own prediction. Last week, I used the weights provided for the 2016 polls, but I wanted to use FiveThirtyEight’s grading system to create weights. I weighed polls that received high grades more highly and for any polls receiving a C+ or less, their impact on the final result was fairly negligible. I also discounted based on how far from election day the poll was conducted with a simple inverse proportionality relationship. I then normalized the weights so that each state saw their poll weights add up to 1. I looked at poll numbers for both Trump and Biden, specifically at the two-party vote share in order to find results that would allow me to construct a prediction for the winner of each state. As stated above, the model predicts Biden to win with 351 electoral votes to Trump’s 187.
Some issues with the model are that, first and foremost, there was not polling for every state. Namely, Illinois, Nebraska, Rhode Island, South Dakota, & Wyoming had not polling, but because none of those are swing states, I felt it was reasonable to using the 2016 results to predict the winner of those states (and Washington D.C., as well), though it is certainly possible that the vote shares in those states are not the same. The model has Biden winning such crucial swing states as Pennsylvania, Florida, and Arizona by higher margins than one might expect. Texas was fairly close but still went to Trump. The biggest surprise to me was that the model predicted North Carolina to go to Biden, which although possible, is probably more unlikely than not in reality. Biden’s polling lead has widened in the past week, but this polling data is not completely updated, so I find it hard to believe that he performed this well. I probably could have spent more time considering what the weights should be, and it is possible that because many of the polls are of registered voters, not likely voters, the results could be slightly biased in favor of Biden, as likely voter screens tend to benefit Republicans.
