2020 Presidential Election Analysis
Eric White
Blog Post 1
September 13th, 2020
In order to make predictions about the outcome of the 2020 Presidential Election, it makes sense to refer to past elections as a reference point to inform our prior. Specifically, it is worth taking note of which states tend to be the most influential on the outcome of the election and which states are most likely to flip from one party to the other. For example, since 1900, only twice (1944 & 1960) has a candidate for president lost the state of Ohio but won the presidency. That does not necessarily mean that the outcome of Ohio is predictive of the outcome of the entire election, but it is worth taking into account when building a predictive model. Similarly, trends indicate that it will probably be crucial for President Trump to win Florida if he hopes to win reelection, as the last time a Republican has lost Florida but won the presidency was in 1924, when our party system looked much different than it does today, as that was an era prior to the New Deal Coalition. Finally, Pennsylvania has the potential to be a possible tipping point state, as indicated by FiveThirtyEight, and its 20 electoral votes are certain to be impactful in this race.
Vote margin by state, 2016 election
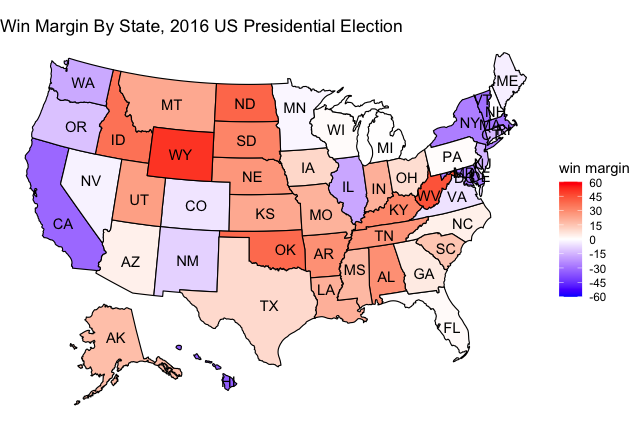
To begin, we should examine the 2016 election results and the voting margin in each state.

Examining this map, it is worth noting that the majority of the states were won by relatively large margins in 2016, as evidenced by the abundance of red and blue colors on the map, as to be contrasted with the relative dearth of white colored states. Those closely contested states in 2016 will likely prove to be pivotal again in 2020. Many analysts have deemed there to be 12 states that are the most relevant in terms of how the election plays out. Some, like the aforementioned Ohio, Florida, and Pennsylvania, have been key swing states for a long time and will likely continue to be, as will be explored later in this blog post. Others, such as Texas and Georgia, have been comfortably held by Republicans since the election of Reagan, and it is hard to see a path to victory for Trump should he lose Texas. Ultimately, a simple conclusion to draw from this map in particular is that there are a number of important states that could help swing the election, and although some may play a bigger role than others, because there are a large number of swing states, there are many possibilities for each candidate in order to win the presidency. This is important to take into account when modeling the election not only because accounting for as many different scenarios as possible will help improve the robustness of the model, but also because there are probably certain combinations of states that could go hand in hand in terms of how they vote. For example, it seems doubtful that Biden would be able to win Ohio but lose Wisconsin, as Wisconsin leans in his favor more so than Ohio and those two states have some similarities in terms of demographics. Understanding the relationships between certain swing states is crucial to constructing an accurate prediction that is internally logical.
Vote margin by state, per election
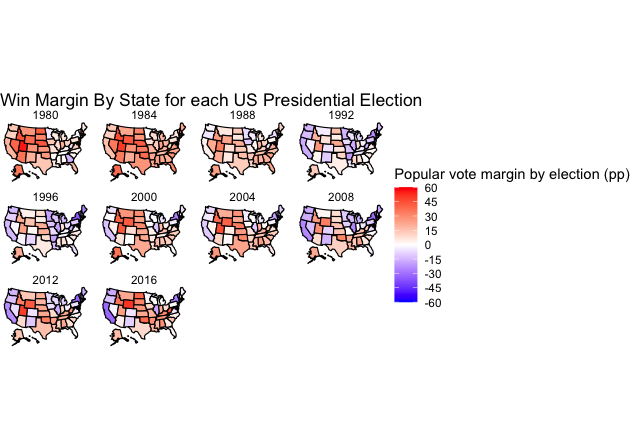
Additionally, it is worthwhile to look at the win margin for each state in each year in order to have a better understanding of how the election has played out each time.

The map above gives a clearer picture of how certain states tend to vote. I only explored the period starting with the 1980 election as that is what is deemed to be the beginning of the “Sixth Party System” in our electoral process, which was ushered in by the Reagan Era and is arguably still the period we exist in today. There is little variance in the voting patterns of the West Coast and Northeast regions of the country in their support for Democratic candidates, and similarly, Southern states remain in the control of Republican candidates. The areas of greatest dispute have been in the Midwest and the Southwest. Incidentally, the states that happen to have the greatest degree of change across this time happen to be some of the states identified above to be important, such as Michigan, Ohio, and Florida. Building on the idea expressed earlier about certain states voting in a similar pattern, this appears to especially be true among midwestern states. This is not to say that all of these states will vote the same in 2020 (they did not in 2016; Minnesota voted differently than Michigan, Wisconsin, and Ohio), but it is an important trend to keep in mind. It makes sense that the candidates who propose the policy agenda that appeals to voters in one state in that area will have an easier time transferring their policy agenda to another nearby swing state. It also could be the case that certain candidates are simply able to captivate the electorate and shift the entire country’s perception of a political party and their ideas, leading them to gain votes across the country, and these tipping point states happen to have such small margins that a nationwide sentiment will impact their results more strongly. The evidence in the next figure may lend support to that latter idea.
Swing state map extension
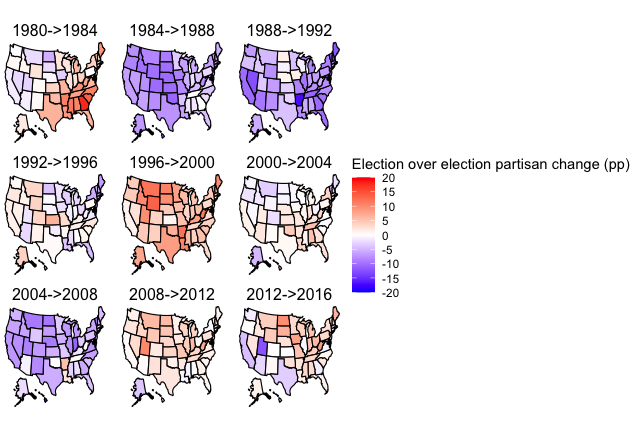
In the map below, we see the change in each parties share of the vote from one election to the next in every election from 1980 to the present. Darker blue states indicate states that have seen their vote share move in favor of Democrats and darker red states have seen their vote share move in favor of Republicans in each given election cycle.

This map is not particularly indicative of any clear trends because in most of the cases, the ultimate victor of the election tends to outperform the previous member of their party who lost the election in states that they still lose handily, states that they flip, and states that they hold onto. There are a few exceptions, most notably Georgia from 1980 to 1984 and Utah from 2012 to 2016. President Carter was from Georgia and thus outperformed most Democrats in that state, so when Reagan was facing Mondale instead of Carter in 1984, he drastically outperformed his 1980 performance. In Utah in 2012, Governor Romney’s Mormon background helped him win an overwhelming victory in that state, while in 2016, Evan McMullin won 21% of the popular vote, meaning that Clinton earned a greater portion of the 2-party popular vote share than Obama did despite not performing dramatically better overall. The most dramatic nationwide differences are seen looking at the differences between 1988 & 1992, 1996 & 2000, and 2004 & 2008; this is unsurprising because in those elections, the party in the White House changed; one would expect a map made of the difference between 2016 and 2020 to look blue all over in the event of a Biden presidency. All in al, when a candidate defeats the incumbent party, it appears that in some cases they tend to have a fairly uniform affect on the voting populace, it just happens to be the case that these differences are not relevant in non-swing states thanks to the electoral college.