2020 Presidential Election Analysis
Eric White
Final 2020 Election Prediction
November 1st, 2020
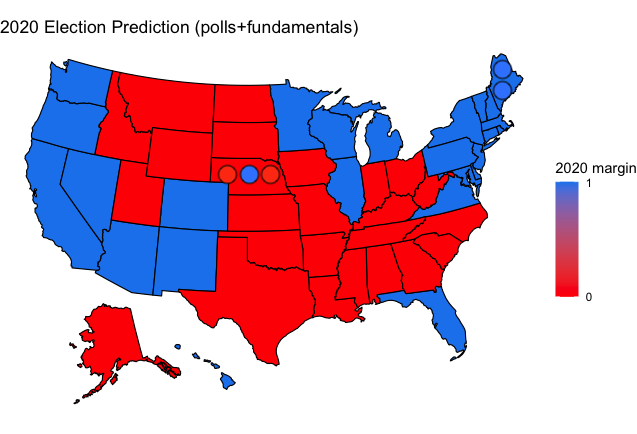
State by state Electoral College prediction for 2020; a 320-218 victory for Biden</sup>
Background
My final election model brings together some of the ideas we have worked on throughout the semester, but is largely focused on polls, as I believe these to be the most effective method for predicting the result of the election. The goal of the predictive model is to determine which candidate will win each state, and though it might make sense to include more fundamental data points such as economic data or demographic data, it is also reasonable to assume that the effects of these variables, to some degree, are included in the polling averages, as the polling data is the best heuristic we have for determining the result of an election. This is not to say that other variables are not important, just that they should not be the focus on the model. For my model, I created a weighted ensemble of polling and fundamental data to create a prediction. I arbitrarily chose to weigh the polls 97.5% and the fundamentals 2.5%. Using the FiveThirtyEight model as a point of comparison, their model comes to only use polling data by the end of the election cycle, with an assumption similar to the one that I detailed above, namely that other factors should ostensibly be baked into the polling average. I wanted to include some amount of demographic data with the intent of hopefully accounting for potential effects that are missed by polling while also not meaningfully changing the general result of the model.
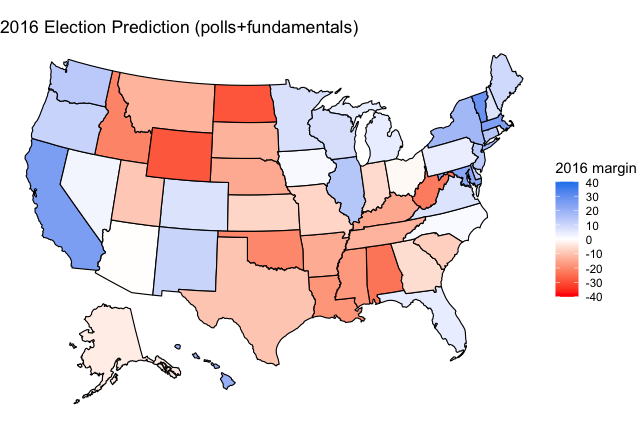
Model Specifics and 2016 Retroactive Fitting
The fundamental data that I used were the following: percentage of the state population that is white, percentage of the state population that is black, percentage of the state population that is over age 65, and unemployment average for that state. The first step in the modeling process was to test if these choices made sense in 2016, so I used 2016 polling data to create a retroactive predictive model for 2016 using the same basic assumptions that I would then use for my 2020 model. I used past data from the elections held in 1992, 1996, 2000, 2004, 2008, and 2012 to run a regression for two-party popular vote share for both the Democratic and Republican candidates. I then used regression to predict the results of the 2016 election; fundamentals models tend to be fairly overfit and are prone to outliers that change the results of the prediction by a significant amount, which was a driving force in my decision to weight the fundamentals model fairly negligibly. Below is code for predicting the 2016 results within an 80% confidence interval for both the Democratic and Republican two-party popular vote share
for (i in 1:length(states))
{
  dreg <- as.numeric(predict(object=lm(D_pv2p ~ white + black + senior + avg_UE, df_x2016 %>% filter(state == states[i])), newdata=df_2016 %>% filter(state == states[i]), interval="confidence", level = 0.8))
  dpred <- append(dpred,dreg[1])
  dlower <- append(dlower,dreg[2])
  dupper <- append(dupper,dreg[3])
  rreg <- as.numeric(predict(object=lm(R_pv2p ~ white + black + senior + avg_UE, df_x2016 %>% filter(state == states[i])), newdata=df_2016 %>% filter(state == states[i]), interval="confidence", level = 0.8))
  rpred <- append(rpred,rreg[1])
  rlower <- append(rlower,rreg[2])
  rupper <- append(rupper,rreg[3])
}
The fundamentals only model produced some results that were difficult to interpret and not all that valuable on their own, as there were negative vote shares and vote shares greater than 100%. I then combined this result with the results of my polls only model. This model weighs polls based on the grade given to them by FiveThirtyEight, the recency of the polls, and the sample size of the polls. Specifically, only polls with the grades of A+, A, A-, B+, B, or B- were counted, and they were weighted with weights of 1, .9, .85, .75, .7, and .65 respectively, with better polls being weighted more. The recency-weight of the polls was determined by a formula based on how many days until the election the polls were finished; the formula is (1/daysout)^.1, where daysout is the number of days until the election. The sample size of the poll was based on a formula from FiveThirtyEight, where they weigh according to sqrt(samplesize/600), where samplesize is the sample size of the poll, with the rationale being that 600 is a reasonable sample size, and those with higher than that should be weighed more, with those that are particularly small being weighed less.
These two models were then combined with the weighting scheme described above. The result was a somewhat convincing Clinton 319-219 victory, but a victory that was entirely within the realm of possibility, as many polls had Clinton winning Florida, Pennsylvania, and Wisconsin, three of the states that the model predcits incorrectly. There are some unexpected results, but on the whole, the model performed reasonably well in 2016 and should be able to be generalized to 2020, with the knowledge that it is possible that the model biases Democratic candidates or candidates of the incumbent party. The out-of-sample performance is therefore reasonably effective and it performs well among non-swing states, which I would hope for to ensure that there were no stunning irregularities. As far as in-sample performance, the R2 values for the fundamentals regressions vary, but at least half of the variance appears to be explained by the model in the majority of states.
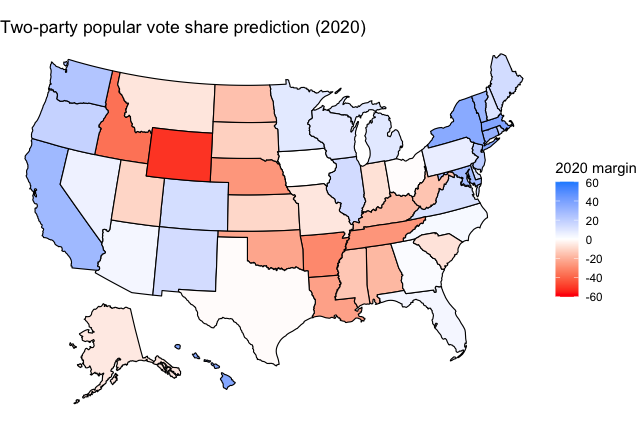
2020 Model
The 2020 Model predicts a 320-218 Biden victory. The results of the prediction are closer, but there is unquestionably a degree of uncertainty in this prediction, driven both by the polls and also the fundamentals regression. Again, a regression was ran using the same explanatory variables to predict a response variable of the two-party popular vote share of each candidate, using data from 1992-2016 this time.
Using a 95% confidence interval, we can determine a range of outcomes for both Biden and Trump and find what their best case scenarios might be. Because Biden holds a fairly substantial polling lead in many states, his best case scenario is much more favorable than Trump’s, though both candidates are victorious in the event of a best-case scenario.
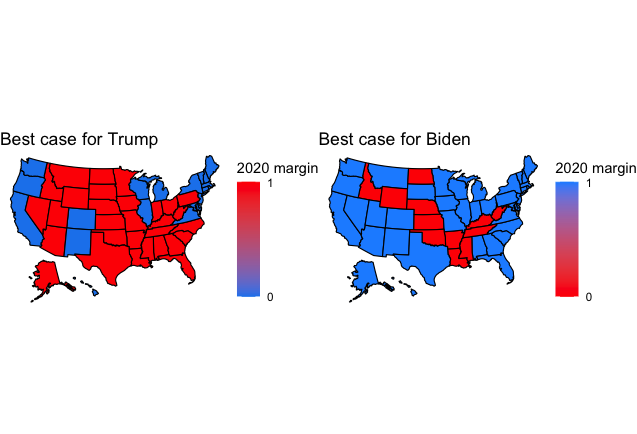
Under a best-case scenario, Biden wins a commanding 439 electoral votes, while Trump wins 287 in his best case scenario. It is hard to see Biden pulling this off, as many of the states that he wins are not swing states, meaning they do not have as many polls, leading them to have a higher standard deviation and thus a larger range of outcomes than Trump’s results, as his victory would come from him winning the swing states where he is currently behind. Though it is possible that he wins Michigan and Wisconsin this year, it is hard to see that being a likely result given the polling, which gives Biden a substantial advantage.
Simulating the election 100 times in each state, I found that the states for which there was the least certainty about a winner were Arizona, Florida, Georgia, Iowa, North Carolina, and Texas, which seems to track relatively closely with other prediction models; my model does not have as much uncertainty about the industrial Midwest states, Michigan, Wisconsin, Pennsylvania, and Ohio, which is a bit concerning considering these states are sure to play a key role in the outcome of the election and there are no guarantees that they will turn out as expected, but nevertheless, it is hard to ignore how consistent the polling has been in these states, making it unlikely that there will be an upset in the Midwest.
Ultimately, though the model predicts a Biden victory, the margin of victory is not much bigger than what was predicted for Clinton in 2016. The polling is not the same in this election cycle, voters are not necessarily going to behave in the same way, and Biden has maintained a relatively comfortable and stable lead in the key swing states in a way that Clinton was not able to do to the same degree. For that reason, though I am skeptical of committing to declaring a Biden victory of a magnitude similar to what I have predicted, I feel confident that the result that I have predicted is among the most likely outcomes, though with the uncertainty of this election, it is unquestionably still a possibility that the result of the election looks more like the Trump best case scenario, particularly considering how the states that he picks up in that scenario are competitive states, whereas Biden’s best case scenario sees him winning states that are assumed not to be competitive.